
For all of the benchmarking I tested at 133 and 166 FSB to give a comparison because I don’t have another motherboard to test against right now. All of the memory settings were at the most aggressive settings and all of the resolutions were set to 640×480 to test the CPU rather than the video card. The 166FSB benchmarks are going to be a better not only because the FSB is higher but the overall CPU speed is higher as well. I will be using the following benchmarks: SiSoft Sandra 2003, 3DMark3002, Quake 3, and Unreal Tournament 2003.
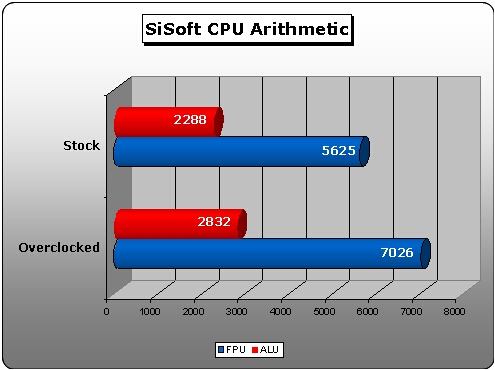
SiSoft Sandra 2003 professional is the newest version to the very popular benchmarking tool. This program has a lot of different informational modules and benchmarking tools. The CPU benchmark will output the MIPS and MFLOPS of the CPU. Along with outputting the results it will show your results in comparison to other setups. With the 1800+ Thoroughbred B the ALU is at 2288 and the FPU at 5625. With the FSB at 166 the ALU is 2832 and the FPU is at 7026 as you can see there is a huge improvement in scores at 166 FSB.
Test Bed
- EPoX 8K9A2+
- 1800+ Thoroughbred B
- 60GB Seagate Barracuda IV HDD
- Corsair 512MB PC3200
- Abit Geforce 4 Ti4200 OTES 8x AGP 128MB
- Cooler Master ATC-101-SX2
- Generic 300w PSU
- Sound Blaster Live! Value
- ATi TV Wonder VE
- Plextor 40x12x40 CDRW
- pioneer 16x DVD
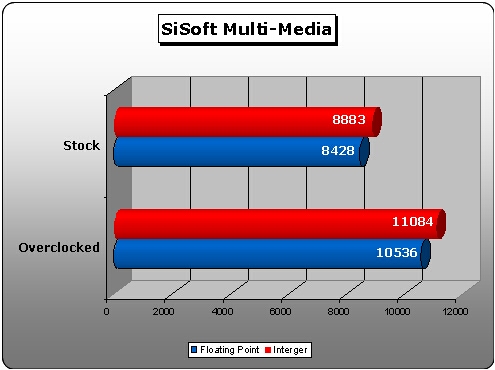
SiSoft Sandra 2003 professional has another benchmark module for a multimedia test. This benchmark will output the Integer aEMMX/aSSE and Floating-Point results from your system. The results at 133FSB was 8883 and 8428. At 166FSB the Integer was 11084 and the floating-point was 10536, once again there is a huge gain in performance.
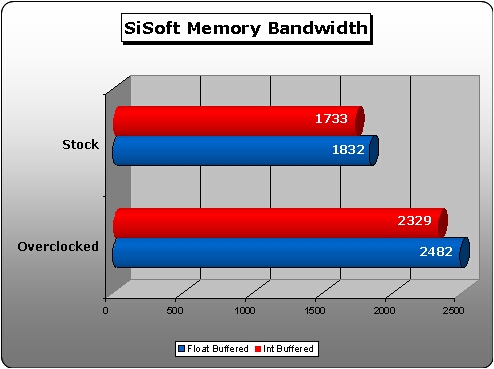
The last SiSoft benchmark I did was for the memory bandwidth. I used a stick of Corsair 512MB PC3200C2 with all of the speed settings at the fastest in the BIOS. At 133FSB the Int Buffered score was 1733 and the Float Buffered score was 1832. After setting the FSB to 166 I reran the benchmark and got a huge boost in my score. The int buffered was 2329 and the float buffered was 2482.
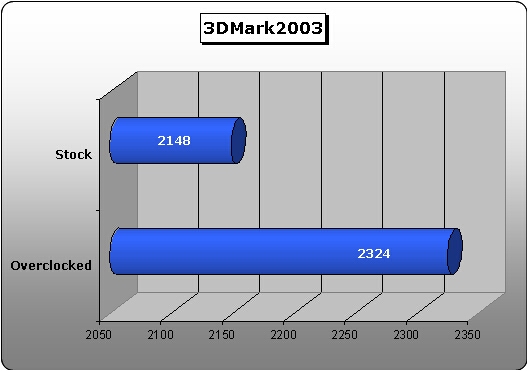
3DMark2003 is the newest benchmarking tool from Futuremark, it is very intensive and will stress your system to the max. Like I said before all of the settings were at the lowest quality and the resolution was at 640×480. I ran the benchmark at 133FSb and got a score of 2148, after upping the FSB to166 I got a score of 2324. There isn’t much of a boost in score on this benchmark but 3DMark2003 is more for testing video cards than motherboards.
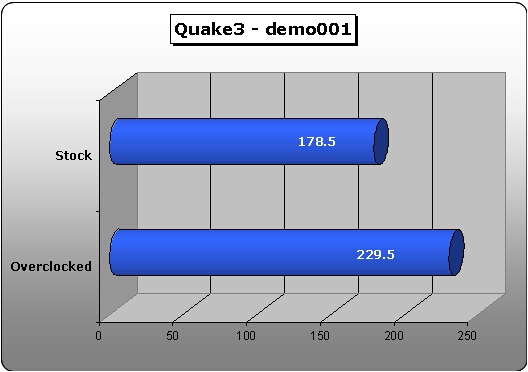
Quake 3 is probably the most used game benchmark around the world and it will be used here as well. All of the graphical and sound settings were set to the lowest to stress the CPU as much as possible. At 640×480 with a FSB of 133 I was able to get 178.5FPS on demo001. After kicking it up to 166FSB I was amazed to see to see that I got 229.5 FPS.
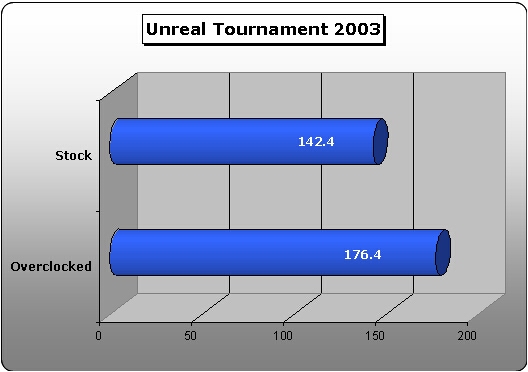
Final testing was done with Unreal Tournament 2003 which is one of the newer and more stressful games. I used the standard benchmarking tool which was included with the game to do this testing so you would be able to more easily compare with the results. The benchmark does a flyby of the map and a bot match benchmark for each resolution. I only made a graph for the flyby because I felt the bot match benchmark was irrelevant because it is done in 3rd person rather than 1st person like the game is played. Again testing at 640×480 at 133FSB I was able to get 142.4FPS and at 166FSB I got 176.4FPS.