

To give the Asus EN6600GT a run for its money we will be pacing the card against an AGP 8x ATI 9800 Pro 256meg. This should be quite a fair comparison, as PCI-Express is the newest motherboard graphics standard. Meaning anyone upgrading to the newest Intel or AMD chipsets will need a graphics card upgrade to go along with the new motherboard. In addition if you’re thinking about flopping down quite a bit of cash on a new hardware setup today, you most likely don’t already have an AGP 6800GT. If you did, you most likely won’t be looking for the 6800GT’s little brother on the PCI-Express side. It’s safe to say many of those looking to upgrade to a latest generation chipset and graphics card run last generation hardware.
The test setups are as follows:
Asus A8N-SLI Deluxe (nForce4-SLI, BIOS 1003.06 Beta), AMD64 3200+ Winchester, Crucial Ballistix Tracer PC4000 2x512mb (DDR400 @ 2.0-2-2-5), Asus EN6600GT (Forceware 66.93), WD Raptor 360DG 36GB, WD 1600BB 160GB, Lite-On DVD-RW SHOW-1213S, Windows XP Pro (SP1 and DX9C)
MSI K8N Neo2 Platinum (nForce3 GB, BIOS 7025v1.41 Beta), AMD64 3200+ Winchester, Crucial Ballistix Tracer PC4000 2x512mb (DDR400 @ 2.0-2-2-5), ATI 9800Pro 256meg (Catalyst 4.12), WD Raptor 360DG 36GB, WD 1600BB 160GB, Lite-On DVD-RW SHOW-1213S, Windows XP Pro (SP1 and DX9C)
Note: Testing in this article only applies to single card operation, not SLI configuration. Check back for Part 3 which will go in depth into the performance and pitfalls of SLI operation.
Synthetic Benchmarks
Synthetic benchmarks attempt to simulate and test real world 3D performance across a large set of hardware and programming features. These benchmarks generally run a series of pre-recorded sequences and measure frames per second in each sequence. Depending on the program and the proprietary formula they use, synthetic benchmarks will output either a number score or an average frames per second value to use for performance comparison against other systems. Synthetic testing is done using program default settings, as these are generally what the community uses to compare different systems to each other.
MadOnion 3DMark01SE – Default Settings
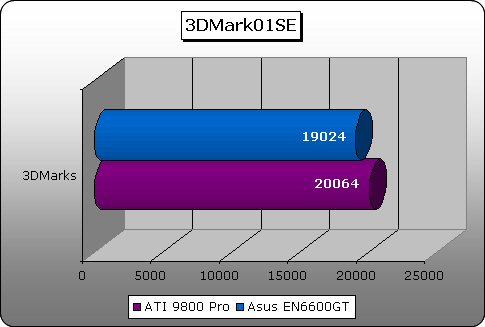
3DMark01SE is a very good overall system test as it doesn’t heavily focus just on the graphics hardware as many other synthetic benchmarks will. The 9800 Pro takes the lead in this test, which could mean several things: the 6600GT setup is being limited by some other hardware, or the 9800 Pro is more capable in older games. The scores are still very comparable however.
Futuremark 3DMark03 – Default Settings
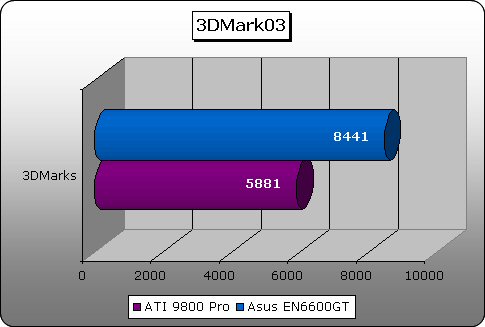
This test is more graphics hardware dependent than 3DMark01SE. You see the 6600GT take a stiff lead. Here the newer features of the 6600 series GPU give it the ability to more efficiently render the scenes.
Futuremark 3DMark05 – Default Settings
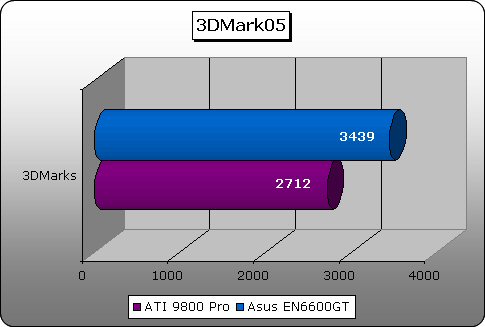
We see the same results here in 3DMark05, as the program suite continues to exploit newer hardware and game technology the older generation card just can’t keep pace.
Massive Development Aquamark3 – Default Settings
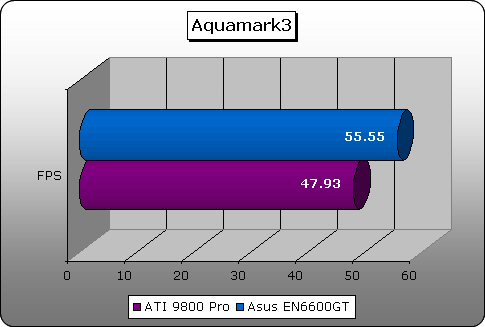
Here we see the two cards come within 7 FPS of each other with the EN6600GT the clear winner. If the synthetic benchmarks are any indication, the EN6600GT should put up a very good fight during the Real world benchmarks. This should be a very capable card.

