
For the testing I did a clean install of Windows XP and applied SP2 so that there wouldn’t be anything unnecessary on the system. I installed the newest drivers for all my components and patched Windows from Windows Update. The following is a list of drivers and important patches: NVIDIA unified driver 5.10, NVIDIA Forceware 66.93 video driver, and DirectX 9c.
Test Bed:
- Abit AA8-3rd Eye
- Intel Pentium 4 2.8GHz LGA775
- 1GB Wintec Amp-X DDR2 PC5400 (4-4-4-10) & Corsair TWIN2X1024-5400C4PRO (4-4-4-12)
- Albatron PCX5750 (425MHz/500MHz)
- 60GB Seagate Barracuda IV hard drive
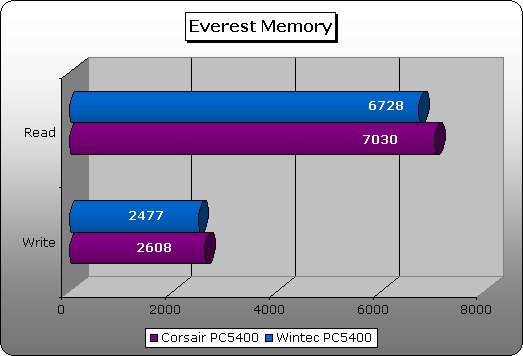
- Everest Home Edition 1.10.106
Memory Benchmark – A synthetic benchmark that yields a MB/s bandwidth of a memory subsystem for both reading and writing. This test is useful for comparing the relative efficiencies of memory performance of two systems using the same memory type. Or it can be used to compare performance differences of two different types of memory on the same system. Higher bandwidths are better.With this testing the Wintec memory is a little lower on bandwidth scores in both the read and write testing compared to the Corsair XMS2 Pro. The difference isn’t huge but at the same time it isn’t insignificant.
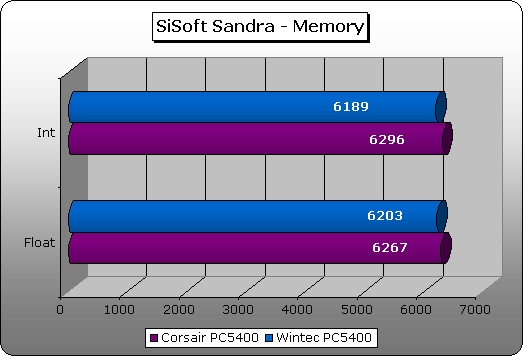
Sisoft Sandra Professional 2005 1.10.37 – Memory Bandwidth Benchmark – A synthetic benchmark that yields a MB/s bandwidth of a memory subsystem. This test is useful for comparing the relative efficiencies of memory performance of two systems using the same memory type. Or it can be used to compare performance differences of two different types of memory on the same system. Higher bandwidths are better.
With SiSoft the difference between Wintec and Corsair was much closer. The difference with the int and float testing was less than 100 MB/s.
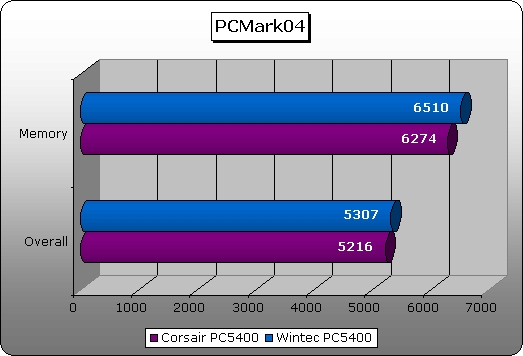
Futuremark PCMark2004 – All tests (excluding graphics) – From Futuremark, the makers of the popular 3DMark graphical benchmarking series, PCMark focuses on the application side of benchmarking. It is a synthetic benchmark that tests an overall systems performance in operations such as file conversions, scientific calculations, web page rendering, memory read/write and file transfers. This program outputs a raw number score which can be used to compare different systems overall performance in applications (graphics tests disabled). Higher scores are better.
I only chose the system performance and memory sections of the benchmark for this review. With this benchmark Wintec outperformed Corsair by a little in the memory testing and overall score.
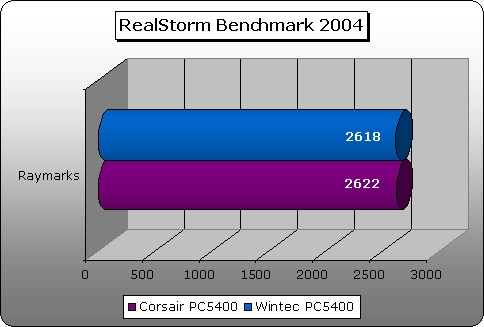
RealStorm Benchmark 2004 – The RealStorm Benchmark 2004 is a software rendering benchmark which will measure the performance of your pc-system. Processor speed, memory speed, cache type/size and motherboard chipset will have big effect on the performance of your system. This benchmark is NOT for comparing the speed of your 3D-accelerator, as it won’t use it at all. The resolution was set to 640×480 and the rest of the settings were left at their default.
The results from this benchmark were basically identical, the Corsair memory got 4 more raymarks than the Wintec.
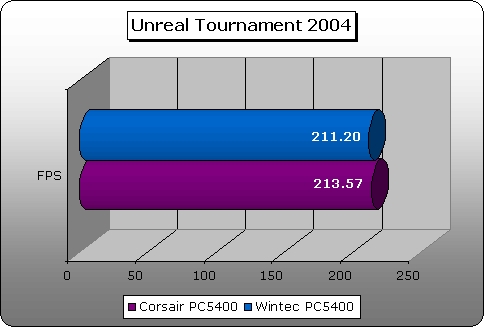
Unreal Tournament 2004 – Unreal Tournament 2004 is a multiplayer first person shooter that combines the kill-or-be-killed experience of gladiatorial combat with cutting-edge technology. Although this benchmark does stress the video card more than the other testing it is always good to see how a system performs as a whole when it comes to gaming. The resolution was set to 640×480 and Bench’emAll was used to run the benchmarking. The following maps were run and the average was calculated from them: dm-rankin, as-convoy, and br-colossus.
Like the results from RealStorm Benchmark 2004 these results are extremely close. The difference between the two is not significant enough to make any real difference and could be the result of many different factors.