I will be using 3DMark2001SE, Vulpine GLmark, Quake 3, and Unreal Tournament 2003 as benchmarks. All of the testing was done with all the eye candy turned on and everything at it’s highest. I benchmarked with the resolutions of 1024×768, 1280×1024, and 1600×1200, I did not do 800×600 because I don’t feel that many people out there are using that low of a resolution. I used nVidia’s 40.72 detonator drivers and ran all the tests from my system which was just formatted.
Test Bed
- EPoX 8K9A2+ (review to come)
- 1800+ Athlon XP
- 60GB Seagate Barracuda IV HDD
- Corsair 512MB PC3200
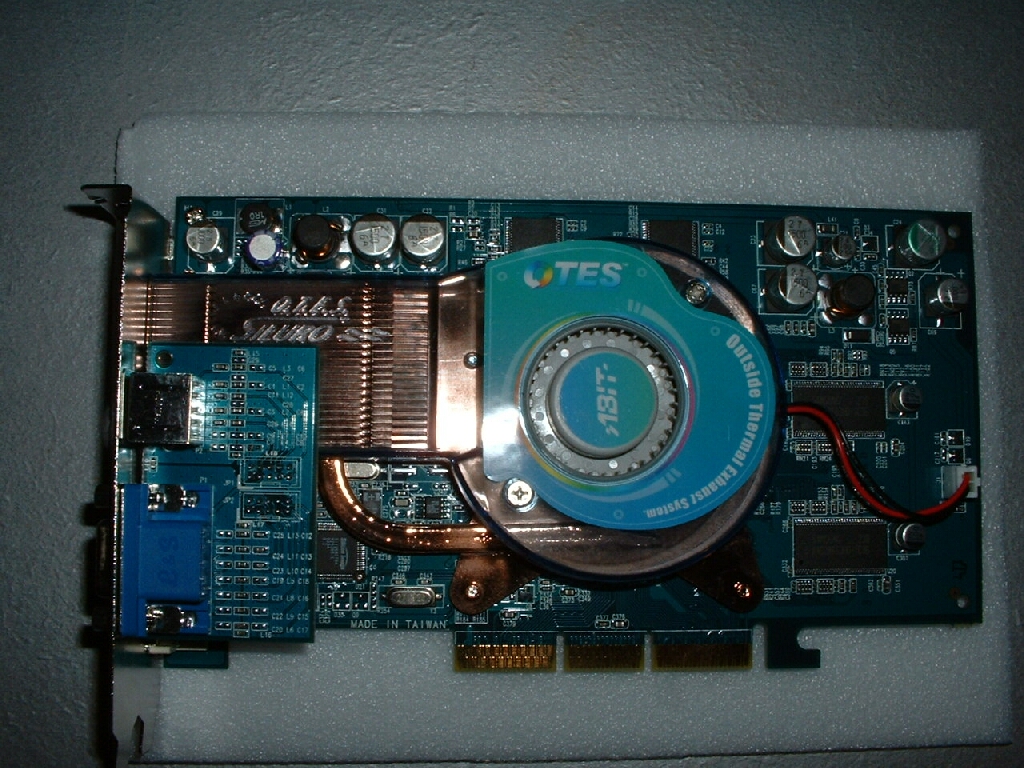
- Abit Geforce 4 Ti4200 OTES 8x AGP 128MB
- Cooler Master ATC-101-SX2
- Generic 300w PSU
- Sound Blaster Live! Value
- ATi TV Wonder VE
- Plextor 40x12x40 CDRW
- pioneer 16x DVD
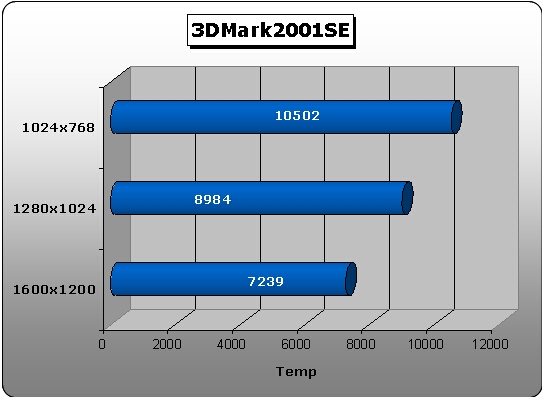
3DMark2001SE is one of the best synthetic benchmarking programs out there and probably used the most for comparison of cards. This card ran 3DMark2001SE great at the default speeds in all three tests. At the default setting for the benchmark the card was easily able to break 10,000 marks and after overclocking would easily to be able to break 11,000 and more. With the higher resolutions the card still did pretty well but of course not as good as with the default settings.
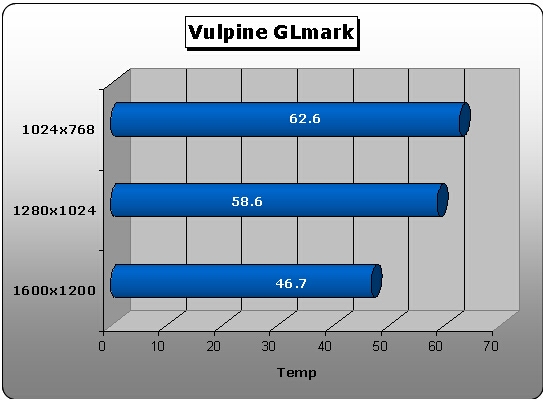
Vulpine GLmark is another synthetic benchmark that is used for video cards, it is not as widely used but I still like it. At 1024×768 the card was able to pump out 62.6FPS which is really good for this Vulpine benchmark. At 1280×1024 it only got a few less at 58.6FPS and at 1600×1200 it dropped quite a bit to 46.7FPS. Even at 1600×1200 the FPS was still high enough so that the testing didn’t look choppy.
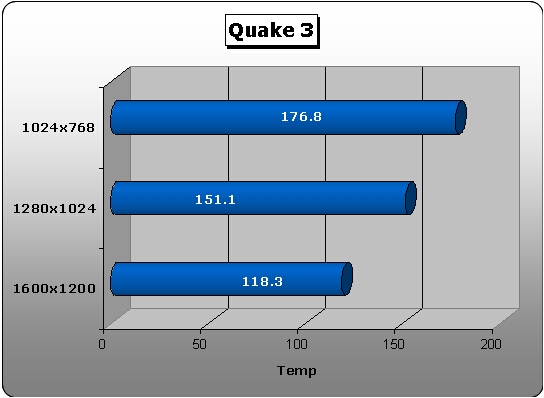
Quake 3 is probably the most used game benchmark around the world and it will be used here as well. All of the graphical and sound settings were set to the highest settings to stress the card as much as possible. Benchmarking at 1024×768 I was almost able to reach 200FPS which is really more than you would ever see. Even at 1600×1200 this video card was able to do 118.3FPS which is really spectacular.
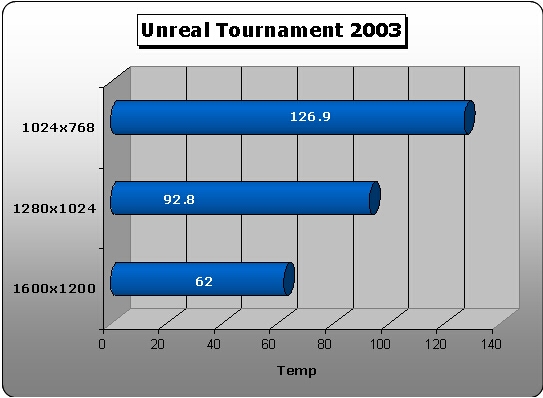
Final testing was done with Unreal Tournament 2003 which is one of the newer and more stressful games. I used the standard benchmarking tool which was included with the game to do this testing so you would be able to more easily compare with the results. The benchmark does a flyby of the map and a bot match benchmark for each resolution. I only made a graph for the flyby because I felt the bot match benchmark was irrelevant because it is done in 3rd person rather than 1st person like the game is played. This being the most intensive benchmark I did the FPS were the lowest that I saw but not disappointing. At 1024×768 this card was able to do 126.9FPS which is really good. At 1600×1200 the score was much lower at 62FPS but even that score is more than enough to play this game without any problem.