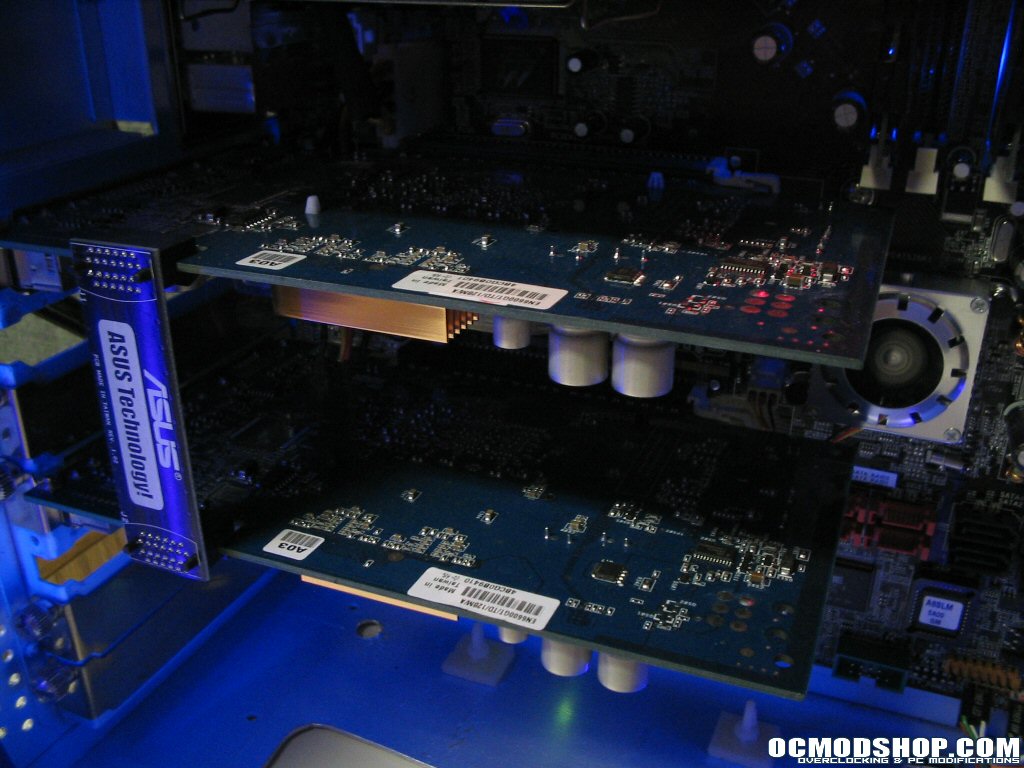
To best test the Asus SLI setup we will compare using one Asus Extreme N6600GT (with motherboard in single graphics card mode) against using two EN6600GT’s (with the motherboard in dual graphics card mode, SLI). nVidia keeps a list on their website of which applications are currently compatible with SLI and have SLI profiles written for them. You can see the list here. We chose applications on this list for testing so we can compare our results against the nVidia claimed, “…up to 1.9x” the performance of a single card.
Asus A8N-SLI Deluxe (nForce4-SLI, BIOS 1003.06 Beta), AMD64 3200+ Winchester, Crucial Ballistix Tracer PC4000 2x512mb (DDR400 @ 2.0-2-2-5), Asus EN6600GT’s (Forceware 66.93), WD Raptor 360DG 36GB, WD 1600BB 160GB, Lite-On DVD-RW SHOW-1213S, Windows XP Pro (SP1 and DX9C)
Synthetic Performance
Synthetic benchmarks attempt to simulate and test real world 3D performance across a large set of hardware and programming features. These benchmarks generally run a series of pre-recorded sequences and measure frames per second in each sequence. Depending on the program and the proprietary formula they use, synthetic benchmarks will output either a number score or an average frames per second value to use for performance comparison against other systems. Synthetic testing is done using program default settings, as these are generally what the community uses to compare different systems to each other.
Futuremark 3DMark03 and 3DMark05 – Default
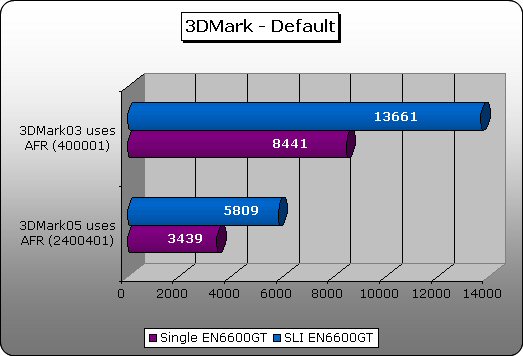
For both 3DMark03 and 3DMark05 Alternate Frame Rendering mode, the more efficient of the two SLI rendering modes, is used. Here you see almost a 62% increase in score when going from single card to SLI setup in 3DMark03. The scores get even better in 3DMark05 with almost a 69% increase. When you think about the fact that as the 3DMark series develops, they every increasingly focus on graphics hardware performance, the transition in scores from ’03 to ’05 makes sense. One impressive note is the fact that during one scene of the 3DMark03 “Wings of Fury” test, FPS broke 1000 for several seconds.
Massive Development Aquamark3 – Default
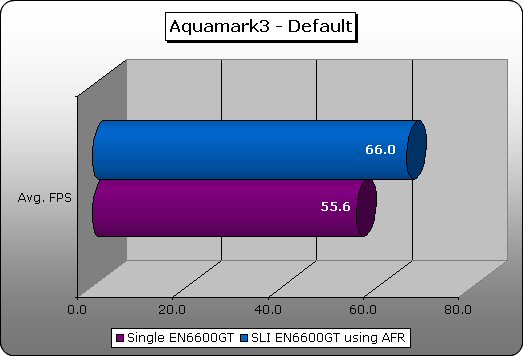
Aquamark3 also uses Alternate Frame Rendering mode. Here we see almost a 19% increase in average FPS when using the SLI setup. Not quite as high as the 3DMark series but still noteworthy.
If the 3DMark series is any indicator to how the Real World Performance should be, well then we would have a very impressive setup on our hands.
Real World Performance
Real World benchmarks are just that. They run a sequence recorded strait from game play (generally called a “timedemo”) from a game that you can run out to the store and buy. At the end of the timedemo an average frames per second value is reported. This value gives a good indication as to how a hardware setup with particular driver settings will perform with that specific game. Testing of Real World benchmarks is done using two different resolutions (1024×768 and 1600×1200) and two different image quality settings (2xAnisotropic Filtering/No Anti-Aliasing and 8xAniso/4xAA).
iD Software Doom 3 – OCmodshop Guardian Demo
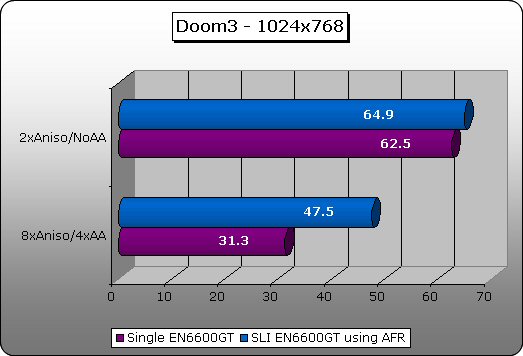
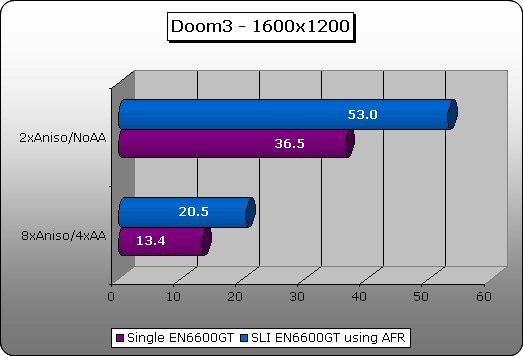
Doom 3 uses Alternate Frame Rendering. You can see that SLI doesn’t do much good at low image quality and low resolution in this game. However when image quality is turned up at low resolution, or as soon as the resolution gets much larger, SLI shines with a 52% increase in frame rates at low resolution high image quality and a 47% increase in performance at high resolution and low image quality. Not an extra 90% in performance, but still good. Frame rates at high resolution and high image quality were still barely playable even on the SLI setup.
Valve Half Life 2 – OCmodshop Coastal Firefight Demo
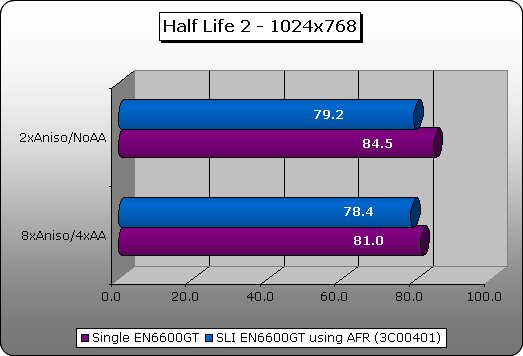
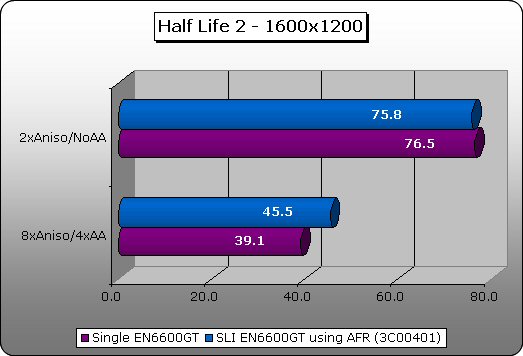
Half Life 2 also uses Alternate Frame Rendering mode like in Doom 3. However you see a completely different scenario here. At low resolutions the SLI setup receives roughly a 3-6% performance deficit over the single EN6600GT. The same performance streak continues up until the high resolution and high image quality where the SLI setup breaks into the lead with a 16% increase in frame rates. These results were confusing at first however it should be noted that tests were repeated with the same results.
Ubisoft Far Cry – HardwareOC Steam Demo
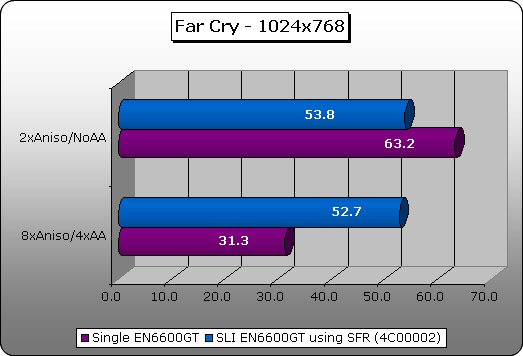
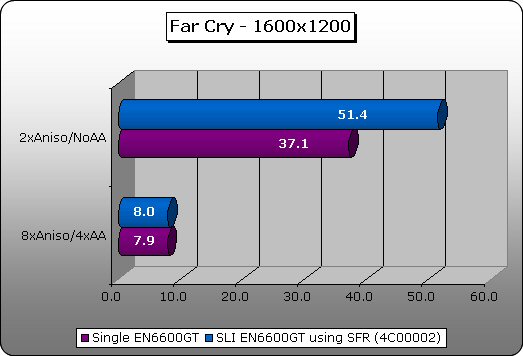
Far Cry uses Split Frame Rendering mode. Here we see a similar situation to Half Life 2 where at low resolution and image quality the SLI setup trails by over 17%. However as soon as image quality settings are turned up on low resolution, SLI takes a commanding lead with over 68% performance increase. The same follows suit with a 38% increase at high resolution low image quality, but both setups seem overwhelmed at high resolution and high image quality. Both setups are unplayable that these settings.
Epic Games Unreal Tournament 2004 – Benchemall Recorded Demo
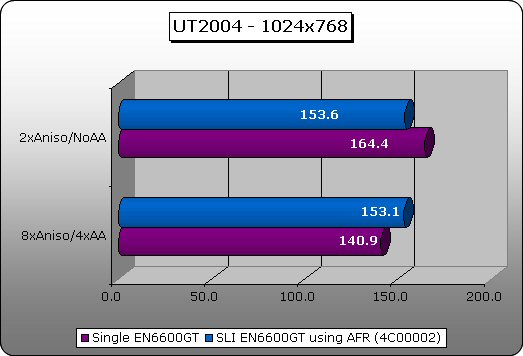
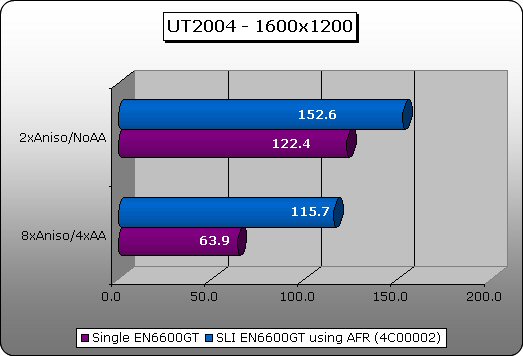
Unreal Tournament 2004 is yet another game to use the more efficient Alternate Frame Rendering mode. Here, again, we see the SLI setup stall a bit at low resolution and low image quality. Though when scaling resolution and image quality, this test seems to be what one would hope to expect from SLI performance. You see over an 8% increase at low resolution high image quality, over 24% increase at high resolution low image quality and an astounding 81% increase at high resolution high image quality! Although even with such a large increase both setups would be very playable at high resolution and high image quality.
Overall the real world gaming performance seems like a mixed bag, and not the shining star that the synthetic benchmarks would lead one to believe. I was quite disappointed in how in many cases the SLI setup seemed to be hindered in the low resolution tests. Curious, I tested a game that was not on the nVidia SLI approved list, Commanche4, which should not use any form of SLI rendering.
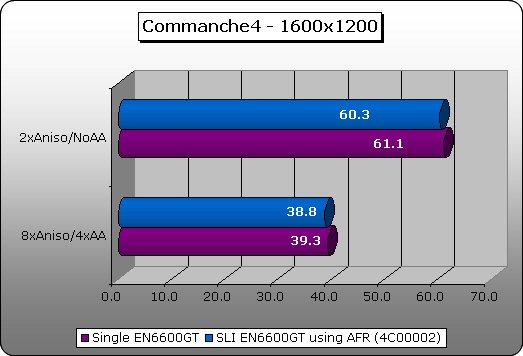
In this high test you can see that in both high and low image quality at high resolution, the SLI setup trailed the single card by roughly 1-2%. This may be due to the fact that there is more hardware/software overhead to control the SLI setup as opposed to the single card, even when only using one GPU.
What we find in the end is that some of the tests do offer good insight as to what SLI could offer, but many exploit some of the deficiencies of the techonology. With the minimum performance difference being a 17% deficit (but still playable) and the highest difference being 81% increase (very near the nVidia claim of up to 90%), it tends to perk some questions as to why exactly the performance may be so muddled at this point in time.