System Specs
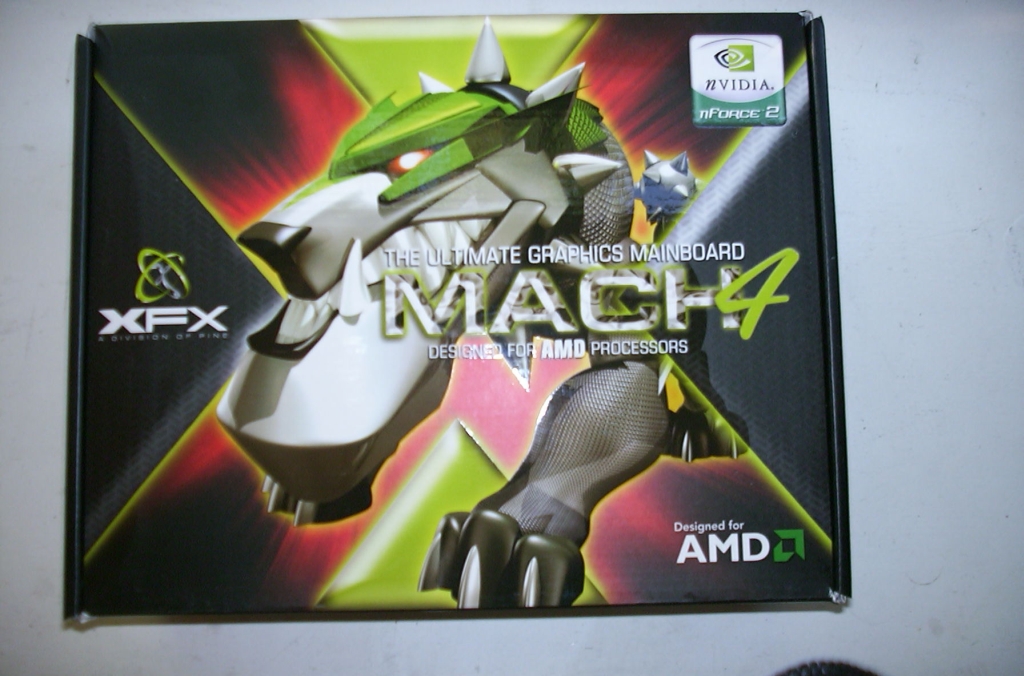
- XFX NF2S-AED motherboard
- Athlon XP 2400+ Thoroughbred Core
- 512MB Corsair XMS3200
- FIC ATI Radeon 9700
- Samsung 52x24x52x CDRW
- Pioneer 16x slot loading DVD-ROM
- Western Digital 80GByte SE Hard drive
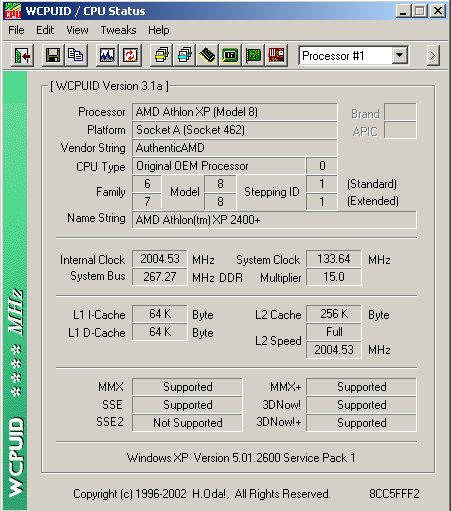
Here’s the WCPUID screen for the non-overclocked 2400+ showing the true speed:
For benchmarking, the standard tool around here is SiSoft Sandra Professional. It is a synthetic benchmark that measures memory, hard drive, and CPU speeds. Although it is a synthetic benchmark, the results are pretty accurate and tend to scale well when measured against real-world applications. Here are the results of the memory bandwidth test. Remember that this is only in single channel mode, since I only have one RAM stick, so the results are lower than they would be if I was running in dual-channel mode. Also, the memory was run at the most aggressive timings available.
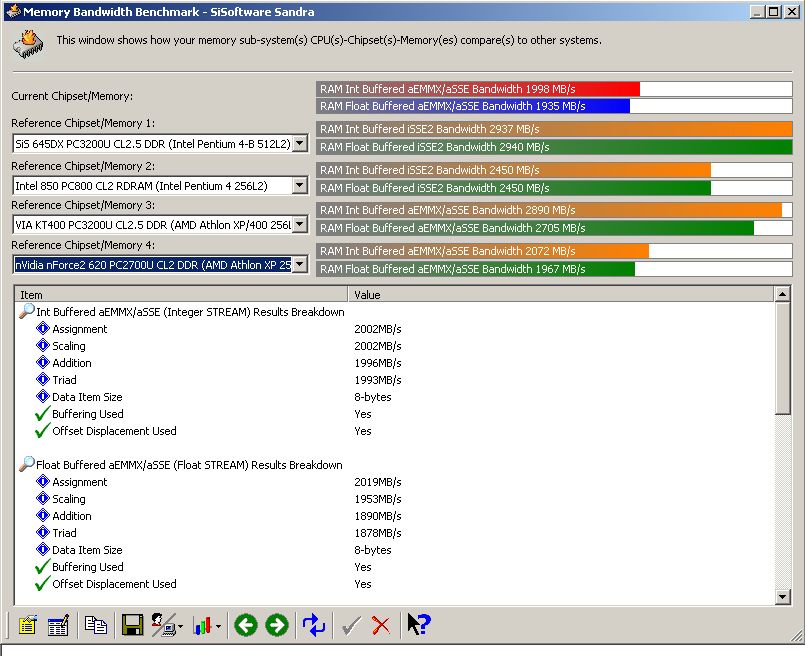
As you can see, the results are somewhat disappointing. The board is easily beaten by the KT400 score that is supplied with Sandra. The score is roughly the same as the nForce2 PC2700 score. I don’t know if this is a result of bad drivers or because it wasn’t running in dual-channel mode, but I’d be willing to say maybe a bit of both. The drivers supplied by nVidia for the nForce2 boards are somewhat lacking (and unstable, in my experience). Let’s check out some scores from the hard drive benchmark.
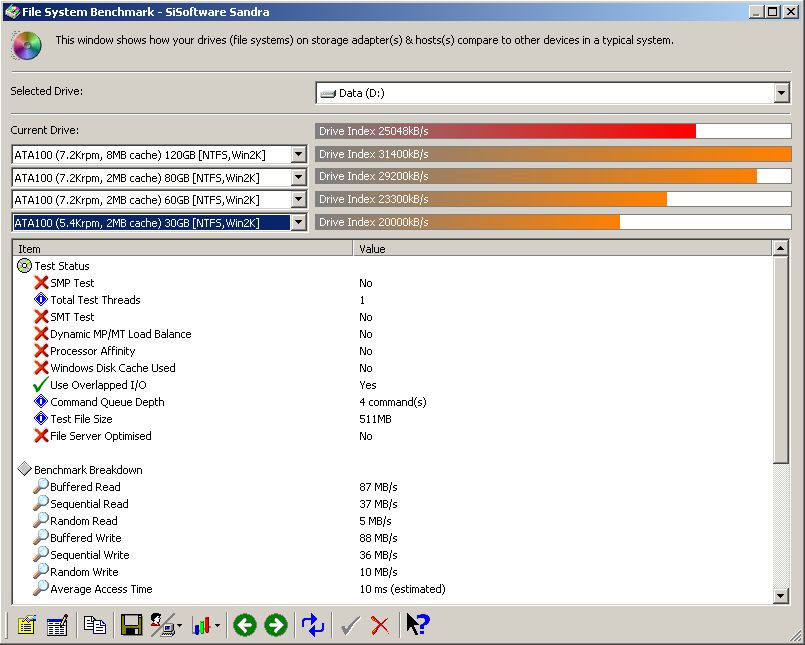
This seems rather low as well, especially considering that I am running the Western Digital Special Edition drive with 8 megs of cache. I attribute this to nVidia’s IDE drivers, which have suffered numerous problems, so much so that they stopped including the accelerated drivers in the latest driver package. Also of note, I experienced data corruption when I tried to use the accelerated drivers that I downloaded from a third party site, so I wouldn’t recommend using them. nVidia took them out of the driver pack for a reason. Here are some CPU scores from Sandra, this will help to determine how efficiently the board handles the processor, compared to other boards.
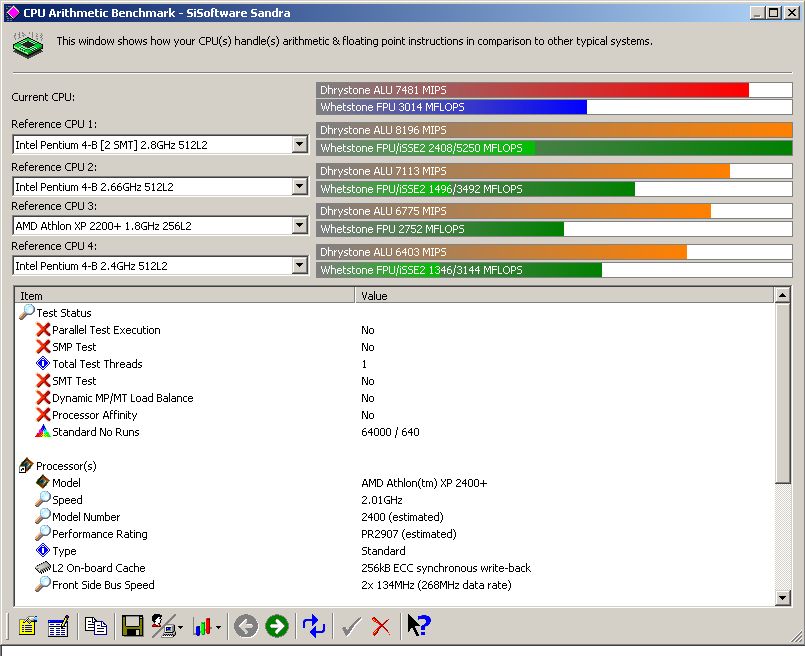
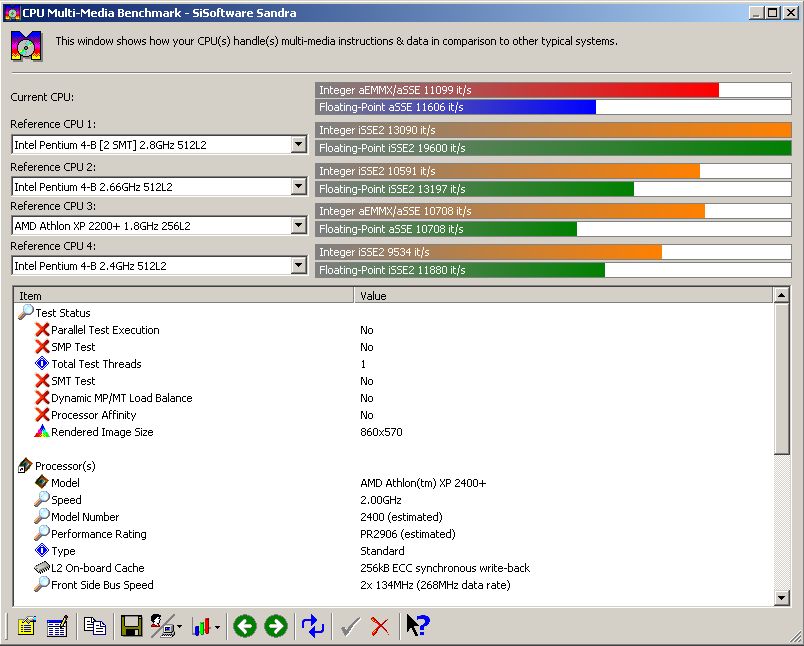
As you can see, the results are consistent with what we would expect from the processor. This score is consistent with scores from my Epox KT400 board, so VIA and nVidia seem to be on about the same page here. Now let’s try out some 3DMark scores to gauge how much overclocking effects game play (the overclocked results will be on the next page).
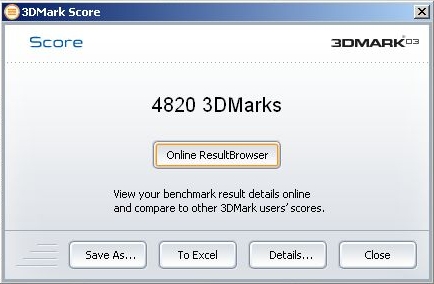
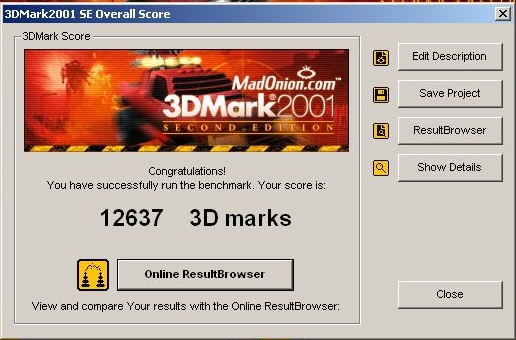
These scores are respectable from this hardware combination. In fact, they are actually higher than the scores I got when I ran the same system with my KT400 board, which shows that the nVidia board is a great choice for gaming. Also, we must take into consideration that 3DMark03 has a sound test, which gauges how much of a performance hit the system takes for running sound. Since this board has onboard 6.1 sound, I decided to give you the individual scores for all 3 sound tests.
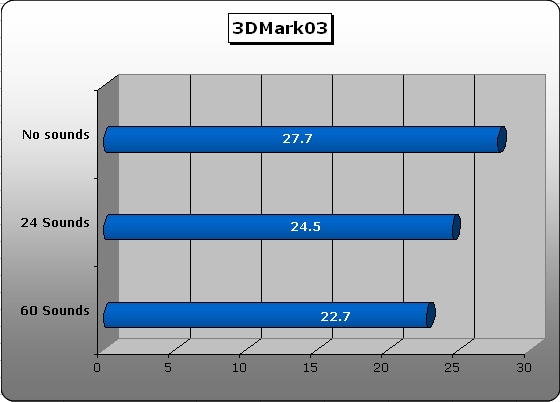
Ouch, these scores are pretty brutal. We’re looking at a loss of 5 FPS on the 60 sounds test, that’s an 18% decrease in FPS as a result of using the onboard sound. Of course, this number will be much less if you choose to forego using the onboard sound, as many of you will do. Let’s see how well these scores compare when we overclock the board.