

System Status
This page shows you the processes going on inside your firewall. The top section shows which Services are running and which are not. This can be helpful in diagnosing memory or performance issues. If you’re trying to VPN in and you see that the VPN service is stopped, well then there’s your answer.
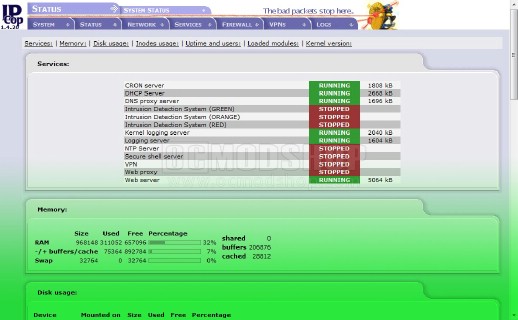
The next sections show memory usage, disk usage and other statistics. You may want to keep an eye on Disk usage if you have logging enabled. I am using an 80GB drive in my firewall and am only using 1% of available space.
Network Status
This page shows you the status of your network adapters. The text of each adapter is colored according to its designation (the orange interface is colored “orange”, etc). This can be helpful in determining which physical card is assigned to which network (you DID write down the MAC address of each card when you installed the hardware, didn’t you?).
Below this are the current dynamic IP address leases, assuming your firewall also functions as a DHCP server. You can see all of the PCs or other internet appliances that use dynamic IP addresses. I can see my DirecTV receiver, Xbox 360, PS3, Wii, PSP, laptops, and other devices.
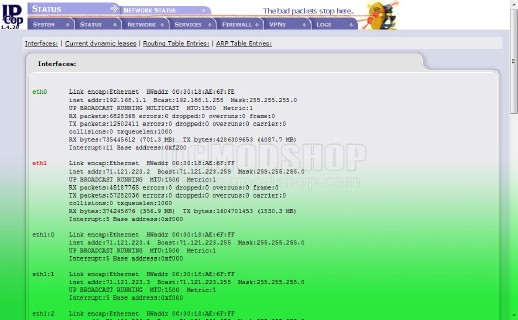
Network Status
System Graphs
This is a neat little graph that auto-updates, showing you statistics like CPU and memory usage over time. This shouldn’t change very often, but can be helpful in diagnosing problems. If you notice your network is choking and at the same time the CPU usage is going through the roof, then either you have too many things running or your hardware isn’t powerful enough for your configuration.
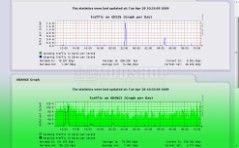
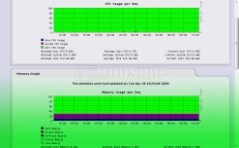
System and Network Graphs
Traffic Graphs
Same type of graphs, but show network traffic on all of your interfaces. The Green graph shows traffic on your internal network only. The Orange graph (assuming you have web servers) shows you how much traffic your small web farm is getting (and how much it’s serving). The Red graph shows the traffic on the internet. Since I have a 20Mbit fat-pipe I can see the obvious spikes when I start downloading large files at 2.5MB/s (yes, that’s MegaBYTES… I love FIOS).
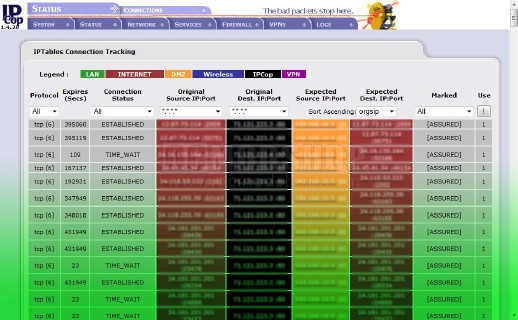
Connections Page
Connections
This shows all of the current point-to-point connections going on through your firewall. Each IP address and port is shows, and each background color coinsides to the appropriate network interface. For example, if you see traffic that goes from Red –> Black –> Orange –> Red then that means an Internet user is being routed to one of your web servers and the firewall is expecting to spit the requested web data back to him. This can be a handy indicator to show exactly how many web users you have at any given time. An internal network client going out to the internet should look like Green –> Red



1 comment
This page is needed for people like me who use a mobile broadband (3G HSDPA) modem to connect to the net. My red interface is an USB stick!
Comments are closed.